10.04.2011

Post-Processing of R Graphs in Inkscape

In creating beautiful graphs for publication or public consumption, R sets the bar pretty high. There are somethings, however, that are not as easy to do with R. For example, a person might want to change the fonts, or move observation labels. While this can be accomplished in R, it is much easier to post-process graphs using third-party software such as Adobe Illustrator.

Inkscape is an  open-source graphics editor that has many of the same features as Adobe Illustrator. Inkscape uses the W3C standard Scalable Vector Graphics (SVG) file format. This format makes it easy to edit and manipulate text separate from the image as a whole. R also has support for saving plots in the SVG format.

The RSvgDevice package includes the function devSVG() to write graphics output to a SVG file. This function operates similarly to the pdf() or jpeg() functions. The dev.off() function is used to complete writing to the SVG file. An example is given below in which the studentized residuals from a regression of Zagat ratings on average price of a meal are plotted against the average cost of the meal. (You can get the data and codebook (MplsZagat) from the EPsy 8262 website here.)

library(car)
library(RSvgDevice)
 
# Fit linear model
model.zagat <- lm(Rating ~ Cost, data = zagat)
 
# Open SVG device
devSVG("/Users/zief0002/Desktop/restaurants.svg", height = 5, 
width = 6)
par(mfrow = c(1,1))
plot(x = zagat$Cost, y = rstandard(model.zagat),  
	xlab="Cost", 
	ylab="Studentized Residuals")
abline(h = 0)
abline(h = -2, lty = "dotted")
abline(h = 2, lty = "dotted")
text(x = zagat$Cost, y = rstandard(model.zagat), labels = zagat$Name, pos = 4)
 
# Turn off SVG device
dev.off()

The plot on the right is what is produced after running the R commands. This plot can then be post-processed using Inkscape. In this example, I have changed the font to Georgia, and rearranged many pf the text labels so that they don't overlap. I also increased the size of the font on the axes labels. You can see the difference between the plot that defaults from R and that same plot that has been post-processed in Inkscape (below).

In the example, the function devSVG() was used to write to the SVG file. The function svg() also works to write to a SVG file, but the text labels are not treated as text in this file. When I examined the XML code, it seems that this function was writing the text nodes as paths rather than text nodes.

One thing to note is that since the SVG file writes as XML, this means that the XML in the file needs to be well formed in order for Inkscape or a browser to open the file properly. For example, I had many ampersands (&) in the labels I used in the scatterplot because they existed in the data frame. These have to either be changed to "and" or the escaped unicode character of "&#038" can be used. (It is probably easier to just replce them with the word "and", then replace the ampersand in the label in Inkscape.)

SVG allows for the creation of interactive graphs as well. Deb Nolan and Duncan Temple-Lang have written the package SVGAnnotation (available on omegahat) that allows for features such as:
  • add tooltips,
  • add hyperlinks,
  • animate the plots,
  • implement simple linking,
  • add CSS information to an SVG document  
For example, rather than having the names of the restaurants on the plot (Sorry Mr. Tufte...I know it's plot clutter...sigh), the tooltips would allow the name of the restaurant to be displayed when hovering your mouse over the observation. You can read a great paper by Deb and Duncan about these features here.

9.06.2011

Minneapolis Food Trucks

A quick mapping project using TileMill. The map depicts the common locations for the Minneapolis Food Trucks. The locations were pulled off of the Heavy Table, and then Google Maps was used to obtain latitude and longitude coordinates. These were input into a GeoJSON file and imported into TileMill.

The actual map allows for interactive hover features. (The map below is just a PNG image of the map, so no interactivity.) Hovering above a truck brings up information about the particular truck. In order to get this functionality outside of the local computer, however, requires TileStream hosting for $49.99/month. 

Future work on this might include writing a script to pull the daily Twitter feeds for the trucks so that the map might be updated daily. Also, making the map interactive would be most informative.

8.12.2011

Computational Art

The following are some of the computational art projects that I have been recently working on. They were all created by stacking images and then averaging the stacked pixels.
Mean Spoon and Cherry
Chile X(Bar)IV


The image on the left is an averaged image of Claes Oldenburg's Spoonbridge and Cherry, 1985-1988 (http://garden.walkerart.org/artwork.wac). I used Python to scrape public images with the Flickr API  using the search string "spoon+cherry".  After eliminating some of the images (e.g., those from other orientations, those with people i the foreground) I was left with n = 211 images which were stacked and averaged.

The picture on the right was created by stacking images of my dog Chili. Her AKC registered name is Chili XIV (thus the new name).

4.29.2011

Comparing Groups: Randomization and Bootstrap Methods Using R

I have recently finished the writing of a manuscript for John Wiley & Sons called Comparing Groups: Randomization and Bootstrap Methods Using R. It is intended as a graduate-level statistics textbook for courses offered in social science programs. The content provides the statistical foundation for researchers interested in answering questions about group differences through the introduction and application of current statistical methods made possible through computation—including the use of Monte Carlo simulation, bootstrapping, and randomization tests. 


Rather than focus on mathematical calculations like so many other introductory texts in the behavioral sciences, the approach taken in this book is to focus on conceptual explanations and the use of statistical computing. The authors agree with the sentiments of David Moore, who stated,

calculating sums of squares by hand does not increase understanding; it merely numbs the mind.
Perhaps the best writing in the book will be in the Foreword, which George Cobb was gracious enough to write (even after reading the book). The website for the book includes all of the data sets, data codebooks, and R scripts used in the book.

You can pre-order the book at Amazon or from Wiley

4.25.2011

My iPhone Data

Earlier this week, data scientists Pete Warden and Alasdair Allen wrote that

your iPhone, and your 3G iPad, is regularly recording the position of your device into a hidden file. Ever since iOS 4 arrived, your device has been storing a long list of locations and time stamps. We're not sure why Apple is gathering this data, but it's clearly intentional, as the database is being restored across backups, and even device migrations.

They also released an open-source application to map this data. Below are two screenshots of my iPhone data. One is zoomed in at the more regional level.


11.06.2009

Reading: Autumn 2009

Wow...it has been a long time since I've updated this beast. But, recently inspired by Nick Hornby, I thought I might attempt another entry. I have been trying to read more books. I have finished several in the last couple months and perhaps a few deserve mention.

Books I've Read
  • When Jesus Came to Harvard (Harvey Cox) - An excellent read by a Harvard Theology Professor who put together a course called "Jesus and the Moral Life." The course examined contemporary ethical dilemmas and was so wildly popular that it was eventually moved into Sanders Hall - the only place large enough to hold symphony and rock concerts on campus.
  • The Pawprints of History: Dogs and the Course of Human Events (Stanley Coren) - The title says it all.
  • The Student Conductor (Robert Ford) - A novel about a young conductor who goes to Germany to study from a master. The book was haunting - set around the time that the Berlin Wall fell - and for a debut novel was spectacular.

  • The Secret Supper (Javier Sierra) and The Lost Painting: The Quest for a Caravaggio Masterpiece (Jonathon Harr) - Both of these books' plots are centered around a painting and the art world....I am a sucker for these types of books.
  • Candy Girl: A Year in the Life of an Unlikely Stripper (Diablo Cody) - Great read. She is an excellent writer...I don't understand the hate for her in the online world.
  • Dead After Dark & Living Dead in Dallas (Charlaine Harris) and Guilty Pleasures (Laurell Hamilton) - The first two books are from a series called the Sookie Stackhouse books and are what the television show True Blood is based on. The third book is the first in the series of Anita Blake novels. Again, I've always been a sucker for the vampire novels....Thank you Anne Rice!
  • The Supreme Court (William H. Rehnquist) and The Genesis of Justice: Ten Stories of Biblical Injustice that Led to the Ten Commandments and Modern law (Alan M. Dershowitz) - The former is a re-read, while the latter was not. I really do love constitutional law.
  • Appetite for Destruction: The Days of Guns N' Roses (Danny Sugerman) - Sugerman managed the Doors, was a heroin addict and married Fawn Hall (Iran-Contra Conflict). He wrote this biography in 1991 and drew on the philosophies of Nietzche, Jung and many others. Probably the only book in which W. Axl Rose, Dionysus, William Blake, Motley Crue and Percy Shelley are all mentioned in the same book. If that doesn't intrigue you, the promotional excerpts on the cover include Ray Manzarek (The Doors), Timothy Leary and Oliver Stone.

Books I've Got in My Queue (I am Currently Reading)
  • Housekeeping vs. The Dirt (Nick Hornby) - The follow-up to the Polysyllabic Spree, is a collection of fourteen months of Nick's column "Stuff I've Been Reading"
  • The Art of Racing in the Rain (Garth Stein) - The novel is narrated by a dog, Enzo, on the last evening of his life. A wonderful book so far...but, I know I will cry at the end.
  • Interred With Their Bones (Jennifer Carrell) - Imagine the DaVinci Code meets Shakespeare...not awesome, but interesting...
  • Vampire Hunter D (Hideyuki Kikuchi) - The author is renowned in Japan for his horror work, and the book was published by Dark Horse (they did 300, Sin City - Note to Greg. It is good no matter what you say. - and Hellboy just to name a few).

Books I Recently Ordered
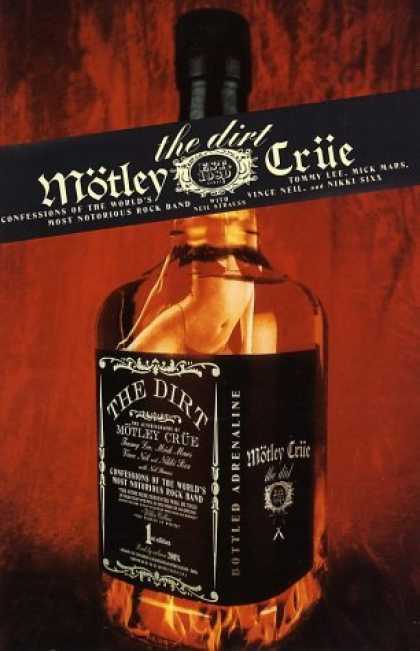
In the spirit of increasing our library and reading interesting books, I recently ordered several books through Abebooks, including: Lost in Music; Midnight in the Garden of Evel Knievel; Motley Crue - The Dirt: Confessions of the World's Most Notorious Rock Band; Introductory Probability and Statistical Inference (the two-volume 1957 work that came out from the Commission on Mathematics); and Computing in Statistical Science Through APL (Thank you George for this recommendation).